 EarthPedia.wiki
Live Earth Data Dashboard – Real-time environmental insights
 Delhi, India
 34.2°C
 AQI: 198
 Partly Cloudy


 Environmental Search Hub


 Forest Loss Counter
Sea Level Tracker
Forest Loss Counter
Sea Level Tracker
 Recent Earthquakes
Climate Insights
Recent Earthquakes
Climate Insights
Latest Posts
Unlocking the Power of Conversational AI: A Deep Dive into Ask ChatGPT

Unlocking the Power of Conversational AI: A Deep Dive into Ask ChatGPTConversational AI has become a pivotal component of modern technology, fundamentally transforming the way humans interact with machines. Among…
Rising Above Normal: Exploring the Latest Air Temperature Anomalies

Introduction: Understanding CO₂ Levels and Temperature Anomalies As we navigate the complexities of global climate change, two terms emerge as critical indicators of our planet’s health: carbon dioxide (CO₂) levels…
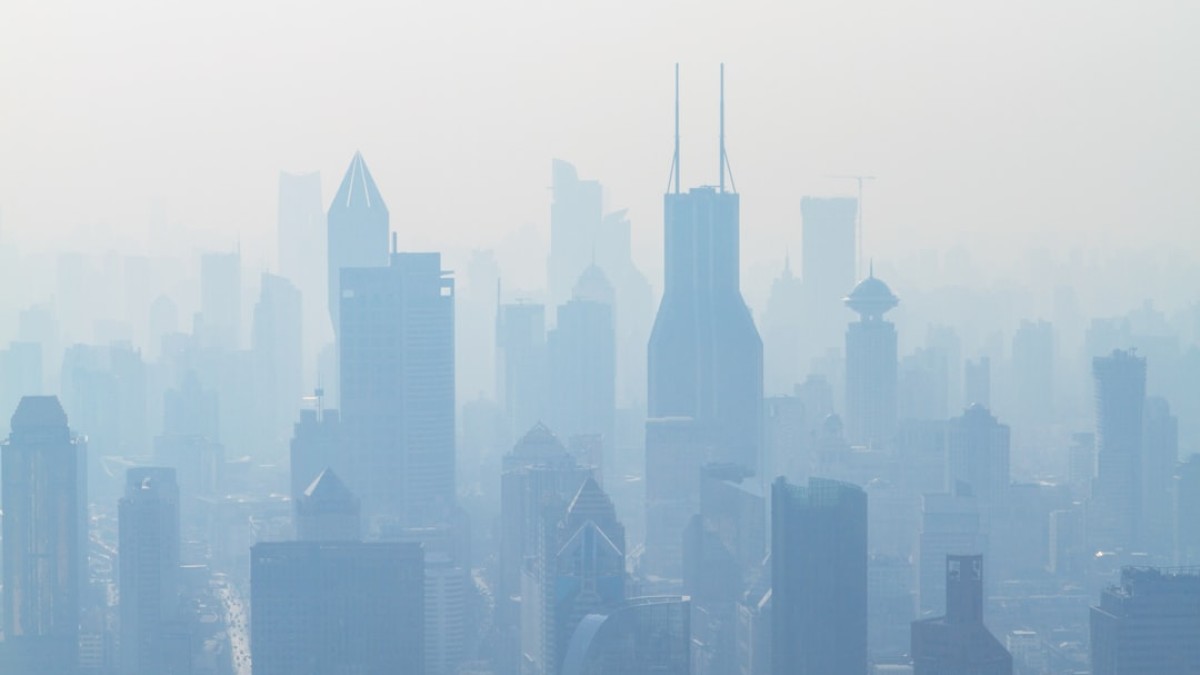
Silent Threats: Understanding the Dangers of Harmful Gas Exposure

Air pollution is an insidious threat to public health, silently seeping into our environments and affecting our well-being. As we venture further into the 21st century, understanding the impact of…
Unpacking the Heat: How Global Warming Affects Our Planet

Introduction: Understanding CO₂ Levels and Global Temperature Anomalies Climate change is no longer a future concern; it is a pressing issue that affects our planet today. At the heart of…
Breathe Easy: 10 Effective Strategies to Combat Air Pollution
Air pollution is one of the most pressing environmental issues of our time, affecting not only the planet but also human health. In this comprehensive guide, we will explore the…
Harnessing Real-Time Earth Data: Revolutionizing Climate Science and Sustainability

In the ever-evolving landscape of climate science, understanding the data behind rising CO₂ levels and global temperature anomalies has never been more crucial. As we grapple with the effects of…
Revolutionizing Climate Monitoring: The Latest Tools for Accurate Temperature Tracking

Introduction: Understanding CO₂ Levels and Global Temperature Anomalies In recent decades, the impact of human activities on Earth’s climate has become increasingly evident. One of the most significant indicators of…
Breathe Easy: How the Air Tracker App is Revolutionizing Air Quality Monitoring

Air quality is a pressing concern as urbanization and industrial activities continue to escalate. The Air Tracker app is leading a revolution in monitoring air quality, allowing users to keep…